Min-Max | Buy-Sell Alert with LevelsMin-Max | Buy-Sell Alert with Levels
Description:
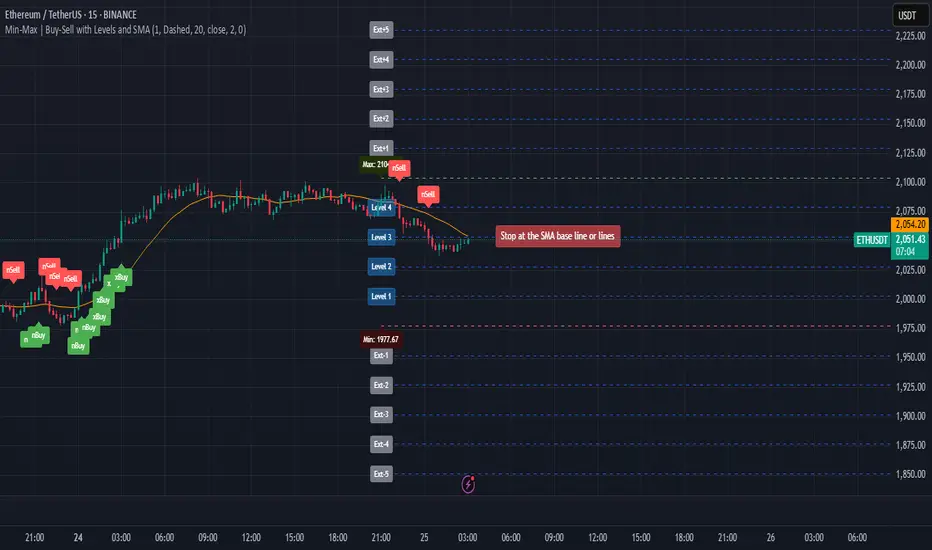
The Min-Max | Buy-Sell Alert with Levels indicator is a powerful tool designed to help traders identify key levels of support and resistance based on the previous day's high and low prices. It plots horizontal lines for the previous day's minimum (Min) and maximum (Max) prices, along with four intermediate levels (Stop Loss 1 to Stop Loss 4) calculated as equal percentage steps between the Min and Max.
This indicator is perfect for traders who want to:
Identify potential entry points when the price returns within the Min-Max range.
Set stop-loss levels based on the calculated intermediate levels.
Receive alerts for buy, sell, and stop-loss conditions.
Key Features:
Previous Day's Min and Max Lines:
Automatically plots the Min (red line) and Max (green line) of the previous day.
These levels act as dynamic support and resistance zones.
Intermediate Stop Loss Levels:
Calculates and plots four intermediate levels (Stop Loss 1 to Stop Loss 4) between the Min and Max.
Each level is equally spaced, representing potential stop-loss or take-profit zones.
Customizable Alerts:
Buy Alert: Triggered when the price returns within the Min-Max range after breaking below the Min.
Sell Alert: Triggered when the price returns within the Min-Max range after breaking above the Max.
Stop Loss Alerts: Triggered when the price reaches any of the four intermediate levels (Stop Loss 1 to Stop Loss 4).
Customizable Appearance:
Adjust the thickness, color, and style (solid, dashed, dotted) of the lines.
Customize the colors of the Stop Loss labels for better visualization.
Labels on the Chart:
Displays "Buy" and "Sell" labels on the chart when the respective conditions are met.
Labels for Stop Loss levels are also displayed for easy reference.
How to Use:
Add the indicator to your chart.
Customize the settings (line colors, thickness, and alert preferences) in the indicator's settings panel.
Use the Min and Max lines as dynamic support and resistance levels.
Monitor the intermediate levels (Stop Loss 1 to Stop Loss 4) for potential stop-loss or take-profit zones.
Set up alerts for Buy, Sell, and Stop Loss conditions to stay informed about key price movements.
Why Use This Indicator?
Simple and Effective: Focuses on the most important levels from the previous day.
Customizable: Tailor the indicator to match your trading style and preferences.
Alerts: Never miss a trading opportunity with customizable alerts for key conditions.
Settings:
Line Thickness: Adjust the thickness of the Min, Max, and intermediate lines.
Line Colors: Customize the colors of the Min, Max, and intermediate lines.
Line Style: Choose between solid, dashed, or dotted lines.
Stop Loss Label Colors: Customize the colors of the Stop Loss labels.
Alerts: Enable or disable alerts for Buy, Sell, and Stop Loss conditions.
Ideal For:
Day traders and swing traders.
Traders who rely on support and resistance levels.
Anyone looking for a clear and customizable tool to identify key price levels.
Disclaimer:
This indicator is for educational and informational purposes only. It does not constitute financial advice. Always conduct your own analysis and trade responsibly.
Get Started Today!
Add the Min-Max | Buy-Sell Alert with Levels indicator to your chart and take your trading to the next level. Customize it to fit your strategy and never miss a key trading opportunity again!
Cerca negli script per "buy sell"
Multi-Indicator Signals with Selectable Options by DiGetMulti-Indicator Signals with Selectable Options
Script Overview
This Pine Script is a multi-indicator trading strategy designed to generate buy/sell signals based on combinations of popular technical indicators: RSI (Relative Strength Index) , CCI (Commodity Channel Index) , and Stochastic Oscillator . The script allows you to select which combination of signals to display, making it highly customizable and adaptable to different trading styles.
The primary goal of this script is to provide clear and actionable entry/exit points by visualizing buy/sell signals with arrows , labels , and vertical lines directly on the chart. It also includes input validation, dynamic signal plotting, and clutter-free line management to ensure a clean and professional user experience.
Key Features
1. Customizable Signal Types
You can choose from five signal types:
RSI & CCI : Combines RSI and CCI signals for confirmation.
RSI & Stochastic : Combines RSI and Stochastic signals.
CCI & Stochastic : Combines CCI and Stochastic signals.
RSI & CCI & Stochastic : Requires all three indicators to align for a signal.
All Signals : Displays individual signals from each indicator separately.
This flexibility allows you to test and use the combination that works best for your trading strategy.
2. Clear Buy/Sell Indicators
Arrows : Buy signals are marked with upward arrows (green/lime/yellow) below the candles, while sell signals are marked with downward arrows (red/fuchsia/gray) above the candles.
Labels : Each signal is accompanied by a label ("BUY" or "SELL") near the arrow for clarity.
Vertical Lines : A vertical line is drawn at the exact bar where the signal occurs, extending from the low to the high of the candle. This ensures you can pinpoint the exact entry point without ambiguity.
3. Dynamic Overbought/Oversold Levels
You can customize the overbought and oversold levels for each indicator:
RSI: Default values are 70 (overbought) and 30 (oversold).
CCI: Default values are +100 (overbought) and -100 (oversold).
Stochastic: Default values are 80 (overbought) and 20 (oversold).
These levels can be adjusted to suit your trading preferences or market conditions.
4. Input Validation
The script includes built-in validation to ensure that oversold levels are always lower than overbought levels for each indicator. If the inputs are invalid, an error message will appear, preventing incorrect configurations.
5. Clean Chart Design
To avoid clutter, the script dynamically manages vertical lines:
Only the most recent 50 buy/sell lines are displayed. Older lines are automatically deleted to keep the chart clean.
Labels and arrows are placed strategically to avoid overlapping with candles.
6. ATR-Based Offset
The vertical lines and labels are offset using the Average True Range (ATR) to ensure they don’t overlap with the price action. This makes the signals easier to see, especially during volatile market conditions.
7. Scalable and Professional
The script uses arrays to manage multiple vertical lines, ensuring scalability and performance even when many signals are generated.
It adheres to Pine Script v6 standards, ensuring compatibility and reliability.
How It Works
Indicator Calculations :
The script calculates the values of RSI, CCI, and Stochastic Oscillator based on user-defined lengths and smoothing parameters.
It then checks for crossover/crossunder conditions relative to the overbought/oversold levels to generate individual signals.
Combined Signals :
Depending on the selected signal type, the script combines the individual signals logically:
For example, a "RSI & CCI" buy signal requires both RSI and CCI to cross into their respective oversold zones simultaneously.
Signal Plotting :
When a signal is generated, the script:
Plots an arrow (upward for buy, downward for sell) at the corresponding bar.
Adds a label ("BUY" or "SELL") near the arrow for clarity.
Draws a vertical line extending from the low to the high of the candle to mark the exact entry point.
Line Management :
To prevent clutter, the script stores up to 50 vertical lines in arrays (buy_lines and sell_lines). Older lines are automatically deleted when the limit is exceeded.
Why Use This Script?
Versatility : Whether you're a scalper, swing trader, or long-term investor, this script can be tailored to your needs by selecting the appropriate signal type and adjusting the indicator parameters.
Clarity : The combination of arrows, labels, and vertical lines ensures that signals are easy to spot and interpret, even in fast-moving markets.
Customization : With adjustable overbought/oversold levels and multiple signal options, you can fine-tune the script to match your trading strategy.
Professional Design : The script avoids clutter by limiting the number of lines displayed and using ATR-based offsets for better visibility.
How to Use This Script
Add the Script to Your Chart :
Copy and paste the script into the Pine Editor in TradingView.
Save and add it to your chart.
Select Signal Type :
Use the "Signal Type" dropdown menu to choose the combination of indicators you want to use.
Adjust Parameters :
Customize the lengths of RSI, CCI, and Stochastic, as well as their overbought/oversold levels, to match your trading preferences.
Interpret Signals :
Look for green arrows and "BUY" labels for buy signals, and red arrows and "SELL" labels for sell signals.
Vertical lines will help you identify the exact bar where the signal occurred.
Tips for Traders
Backtest Thoroughly : Before using this script in live trading, backtest it on historical data to ensure it aligns with your strategy.
Combine with Other Tools : While this script provides reliable signals, consider combining it with other tools like support/resistance levels or volume analysis for additional confirmation.
Avoid Overloading the Chart : If you notice too many signals, try tightening the overbought/oversold levels or switching to a combined signal type (e.g., "RSI & CCI & Stochastic") for fewer but higher-confidence signals.

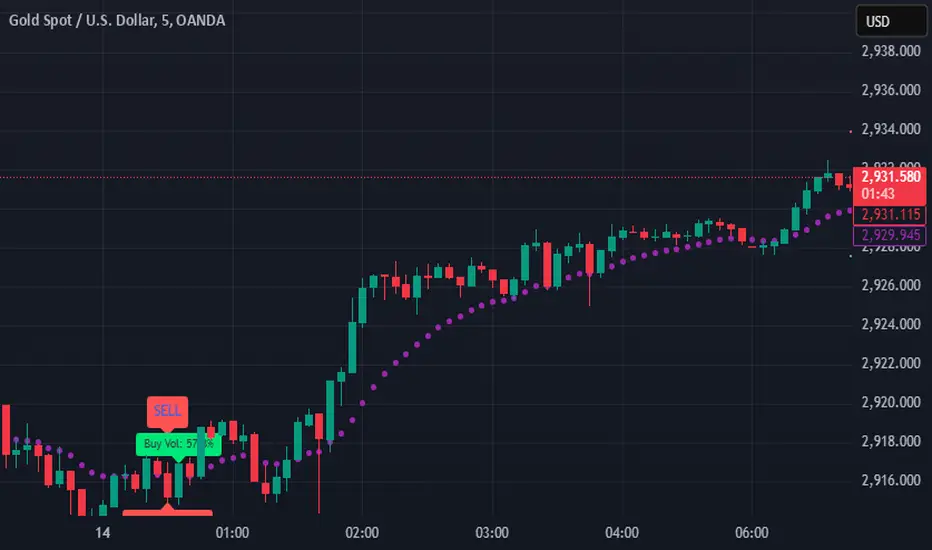
SIOVERSE EMA 15 with Buy/Sell Signals, Support & ResistanceThis Pine Script indicator is designed for TradingView and combines Exponential Moving Averages (EMAs), support and resistance levels, buy/sell signals, and volume percentage labels filtered by buy/sell conditions. It is a comprehensive tool for traders who want to analyze price trends, identify key levels, and make informed decisions based on volume and EMA crossovers.
Key Features of the Indicator
EMA 15 (Purple Dashed Line):
A 15-period Exponential Moving Average (EMA) is plotted on the chart as a dashed purple line.
This EMA helps traders identify short-term trends and potential entry/exit points.
Hidden EMA 21 and EMA 34:
The 21-period and 34-period EMAs are calculated but not displayed on the chart.
These EMAs are used to generate buy and sell signals based on crossovers.
Buy/Sell Signals:
Buy Signal: Occurs when the EMA 21 crosses above the EMA 34. A green "BUY" label is displayed below the candle.
Sell Signal: Occurs when the EMA 21 crosses below the EMA 34. A red "SELL" label is displayed above the candle.
These signals help traders identify potential trend reversals or continuations.
Support and Resistance Levels:
Support: The lowest price level over the last lookback_period candles, plotted as a green dashed horizontal line.
Resistance: The highest price level over the last lookback_period candles, plotted as a red dashed horizontal line.
These levels help traders identify key price zones for potential breakouts or reversals.
Volume Percentage Labels (Filtered by Buy/Sell Signals):
The volume percentage is calculated relative to the average volume over the last volume_lookback candles.
Buy Volume Label: When a buy signal occurs, a green label is displayed above the candle with the text "Buy Vol: X.XX%", where X.XX is the volume percentage.
Sell Volume Label: When a sell signal occurs, a red label is displayed below the candle with the text "Sell Vol: X.XX%", where X.XX is the volume percentage.
These labels help traders assess the strength of the buy/sell signals based on volume.
Alerts:
Alerts are triggered when buy or sell signals occur, notifying traders of potential trading opportunities.
Multi-Moving Average Buy/Sell IndicatorThis Multi-Moving Average Buy/Sell Indicator is a powerful and customizable tool designed to help traders identify potential buy and sell signals based on the interaction between price and multiple moving averages. Whether you're a day trader, swing trader, or long-term investor, this indicator provides clear visual cues and alerts to help you make informed trading decisions.
Key Features
1. Multiple Moving Averages
The indicator calculates four key moving averages:
9-period MA
20-period MA
50-period MA
180-period MA
You can choose the type of moving average:
SMA (Simple Moving Average)
EMA (Exponential Moving Average)
WMA (Weighted Moving Average)
2. Custom Timeframe
Select a custom timeframe from a user-friendly dropdown menu:
1 Minute
5 Minutes
15 Minutes
30 Minutes
1 Hour
4 Hours
Daily
Weekly
The indicator dynamically adjusts to the selected timeframe, making it suitable for all trading styles.
3. Buy/Sell Signals
Buy Signal: Triggered when the price crosses above any of the moving averages.
Sell Signal: Triggered when the price crosses below any of the moving averages.
Signals are displayed as labels on the chart:
Green "BUY" Label: Below the bar when a buy signal is triggered.
Red "SELL" Label: Above the bar when a sell signal is triggered.
4. Visualization
Toggle the visibility of all moving averages using the showAllMAs input.
Moving averages are plotted with distinct colors for easy identification:
9 MA: Blue
20 MA: Orange
50 MA: Purple
180 MA: Teal
5. Alerts
The indicator generates alerts for buy and sell signals, which can be used for notifications or automated trading.
How to Use
Add the Indicator:
Open TradingView and go to the Pine Script Editor.
Copy and paste the script into the editor.
Click Add to Chart.
Configure Inputs:
maType: Choose the type of moving average (SMA, EMA, WMA).
timeframe: Select a custom timeframe (e.g., "1 Minute", "Daily").
showSignals: Toggle to show or hide buy/sell signals.
showAllMAs: Toggle to show or hide all moving averages.
Interpret the Signals:
Look for green "BUY" labels below the bars for potential buy opportunities.
Look for red "SELL" labels above the bars for potential sell opportunities.
Set Alerts:
Use the built-in alert system to get notified when buy or sell signals are triggered.
Example Use Cases
Day Trading
Use a 1-minute or 5-minute timeframe with an EMA for quick signals.
Example Inputs:
maType = "EMA"
timeframe = "5 Minutes"
showAllMAs = true
Swing Trading
Use a daily timeframe with an SMA for longer-term signals.
Example Inputs:
maType = "SMA"
timeframe = "Daily"
showAllMAs = false
Why Use This Indicator?
Versatility: Suitable for all trading styles and timeframes.
Customization: Choose your preferred moving average type and timeframe.
Clear Signals: Easy-to-read buy/sell labels and moving averages.
Alerts: Never miss a trading opportunity with built-in alerts.
Limitations
False Signals:
The indicator may generate false signals in choppy or sideways markets. Always combine it with other tools (e.g., RSI, volume analysis) for better accuracy.
Timeframe Dependency:
The effectiveness of the signals depends on the selected timeframe. Shorter timeframes may produce more signals but with higher noise.
No Backtesting:
The script does not include backtesting functionality. Test the strategy manually on historical data.
Customization Options
Add More Moving Averages: Modify the script to include additional moving averages (e.g., 200 MA).
Change Signal Logic: Adjust the conditions for buy/sell signals (e.g., require confirmation from multiple moving averages).
Add Alerts for Specific MAs: Create separate alerts for signals based on specific moving averages (e.g., only 9 MA or 50 MA).

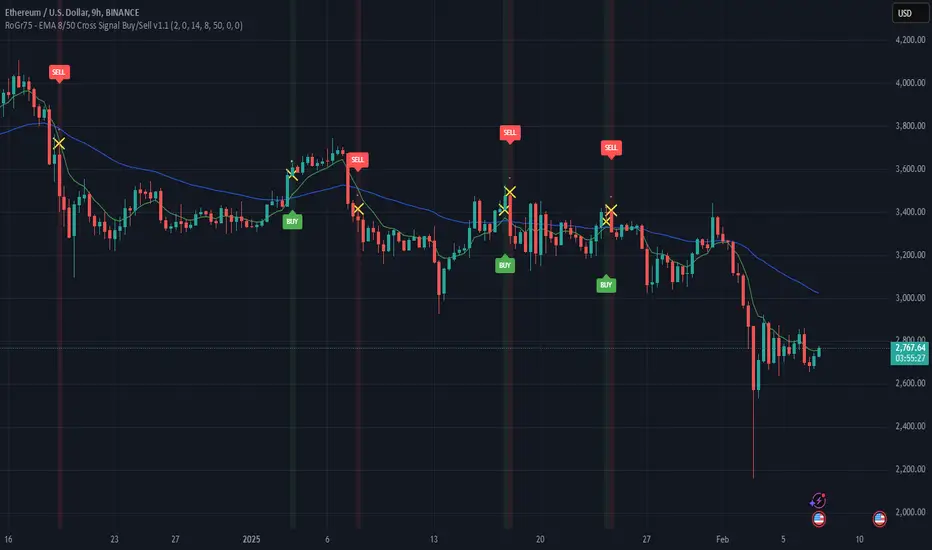
RoGr75 - EMA 50/8 Cross With Buy/Sell Signals RoGr75 - EMA 50/8 Cross With Buy/Sell Signals
---
**Overview:**
This script is designed to generate **Buy** and **Sell** signals based on the crossover and crossunder of two Exponential Moving Averages (EMAs): **EMA 8** (green line) and **EMA 50** (blue line). The signals are plotted at a user-defined distance from the candles, ensuring clear visibility and adaptability to market volatility.
---
**Key Features:**
1. **EMA Cross Signals**:
- A **Buy Signal** is generated when the **EMA 8** crosses above the **EMA 50**.
- A **Sell Signal** is generated when the **EMA 8** crosses below the **EMA 50**.
2. **Variable Signal Distance**:
- The distance of the Buy and Sell signals from the candles is controlled by a **user-defined input** (`signal_distance`).
- The distance is calculated using the **Average True Range (ATR)** to adapt to market volatility.
3. **Customizable Parameters**:
- `signal_distance`: Adjust the distance of the signals from the candles (default: 2.0).
- ATR period: Fixed at 14 but can be modified in the script.
4. **Visual Enhancements**:
- Buy signals are displayed as green labels below the candles.
- Sell signals are displayed as red labels above the candles.
- Optional background highlighting for Buy and Sell signals.
---
**How It Works:**
- The script calculates the **EMA 8** and **EMA 50** and plots them on the chart.
- When a crossover or crossunder occurs, a label is placed at a distance determined by the formula:
- **Buy Signal Position**: `low - (signal_distance * ATR(14))`
- **Sell Signal Position**: `high + (signal_distance * ATR(14))`
- The signals are clearly visible and adapt to the volatility of the asset.
---
**Input Parameters:**
- `signal_distance` (type: input float): Controls the distance of the Buy and Sell signals from the candles. Default value is `2.0`.
---
**Usage:**
1. Add the script to your chart in TradingView.
2. Adjust the `signal_distance` input to set the desired distance of the signals from the candles.
3. Monitor the Buy and Sell signals generated by the script for potential trading opportunities.
---
**Example:**
- If `signal_distance` is set to `2.0`, the Buy signal will appear **2x ATR** below the candle's low, and the Sell signal will appear **2x ATR** above the candle's high.
---
**Customization:**
- Modify the ATR period or replace it with a fixed value for static distance.
- Adjust the colors, styles, and sizes of the labels and EMAs to suit your preferences.
---
**Ideal For:**
- Traders looking for a simple and effective EMA crossover strategy.
- Users who want customizable signal placement for better visibility.
- Those who prefer volatility-adjusted signal distances.
---
**Note:**
This script is for educational and informational purposes only. Always backtest and validate strategies before using them in live trading.
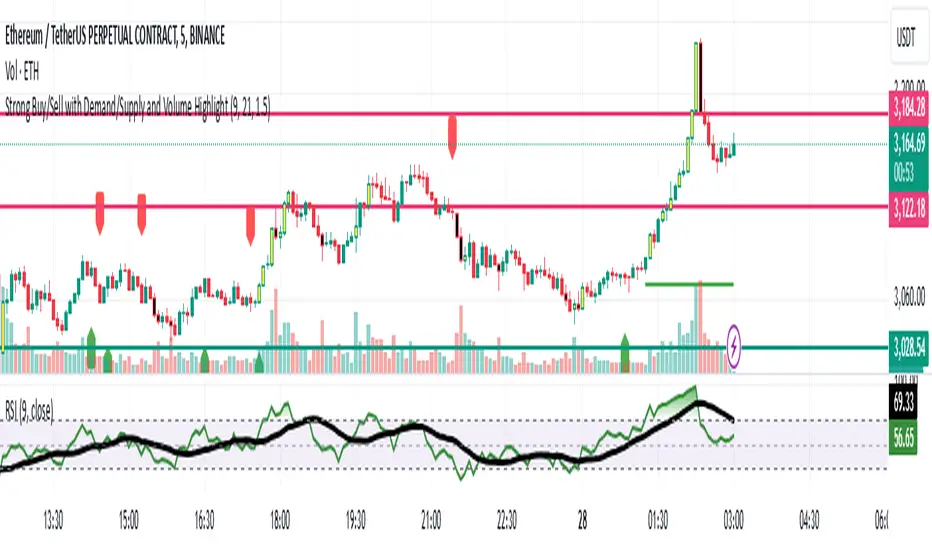
Strong Buy/Sell with Demand/Supply and Volume HighlightStrong Buy/Sell with Demand/Supply and Volume Highlight
This indicator combines key technical elements to provide traders with robust buy and sell signals while highlighting significant market zones and volume trends. It's designed for traders seeking clarity and precision in their decision-making process.
Features:
Dynamic Buy/Sell Signals:
Utilizes the crossover of a fast EMA (default: 9) and a slow EMA (default: 21) to generate reliable buy and sell signals.
Buy signals are marked with green upward labels, while sell signals are marked with red downward labels.
Demand and Supply Zone Detection:
Automatically plots demand (support) and supply (resistance) zones based on recent price movements when buy or sell signals are triggered.
Zones are visually marked with lines for quick identification of key price levels.
Volume Analysis:
Highlights candles with high volume relative to the average 20-period volume (adjustable via the volume multiplier input).
High-volume bullish candles are marked green, and bearish candles are marked red, allowing traders to spot significant market activity instantly.
Inputs:
EMA Periods: Customizable fast and slow EMA settings to adjust signal sensitivity.
Demand/Supply Zones: Option to toggle the visibility of demand and supply levels.
Volume Multiplier: Control the threshold for detecting high-volume candles.
How to Use:
Buy Opportunities: Look for buy signals when the fast EMA crosses above the slow EMA, supported by demand zones and high volume.
Sell Opportunities: Observe sell signals when the fast EMA crosses below the slow EMA, reinforced by supply zones and bearish high-volume candles.
Combine this indicator with your trading strategy to enhance decision-making and improve trade timing.
This indicator is suitable for multiple timeframes and markets, making it a versatile tool for scalpers, day traders, and swing traders.
5-Minute Buy/Sell SignalThe 5-Minute Buy/Sell Signal Indicator is designed to help short-term traders identify potential buy and sell opportunities on a 5-minute chart using a combination of multiple technical indicators. This indicator integrates the following key components to generate buy and sell signals:
MACD (Moving Average Convergence Divergence):
The MACD helps identify the strength and direction of the market trend by comparing the difference between short-term and long-term moving averages. A positive MACD histogram indicates bullish momentum, while a negative histogram indicates bearish momentum.
RSI (Relative Strength Index):
The RSI is a momentum oscillator that measures the speed and change of price movements. The indicator is used to determine overbought or oversold conditions:
Oversold (below 30): Potential buy signal.
Overbought (above 70): Potential sell signal.
EMA (Exponential Moving Average):
The 50-period EMA is used to determine the prevailing trend. When the price is above the EMA, it indicates a bullish trend; when it is below the EMA, it indicates a bearish trend.
Volume:
The indicator incorporates volume analysis to confirm the strength of signals. Signals are only considered valid when the current volume exceeds the average volume over the last 20 periods, ensuring that there is sufficient market participation to support the move.
Signal Generation:
Buy Signal:
The signal is generated when:
MACD histogram is positive (bullish momentum).
RSI is below the oversold level (indicating a potential reversal).
The price is above the 50-period EMA (indicating an uptrend).
Current volume is higher than the 20-period volume moving average (confirming the strength of the buy signal).
Sell Signal:
The signal is generated when:
MACD histogram is negative (bearish momentum).
RSI is above the overbought level (indicating a potential reversal).
The price is below the 50-period EMA (indicating a downtrend).
Current volume is higher than the 20-period volume moving average (confirming the strength of the sell signal).
Signal Display:
Buy Signal: A green "BUY" label appears below the bar when all buy conditions are met.
Sell Signal: A red "SELL" label appears above the bar when all sell conditions are met.
Usage:
This indicator is specifically designed for 5-minute charts, making it ideal for scalpers and day traders who need quick, reliable signals to trade in short timeframes. By combining multiple indicators—MACD, RSI, EMA, and Volume—the system ensures that the buy or sell signals are well-confirmed, reducing the likelihood of false signals and increasing the probability of successful trades.
Alert Conditions:
Alerts can be set up for both buy and sell signals, enabling traders to be notified when the conditions for a potential trade are met, ensuring they never miss a trading opportunity.
In summary, this indicator provides a comprehensive, multi-faceted approach to identifying buy and sell opportunities, helping traders make more informed decisions based on a detailed technical analysis.
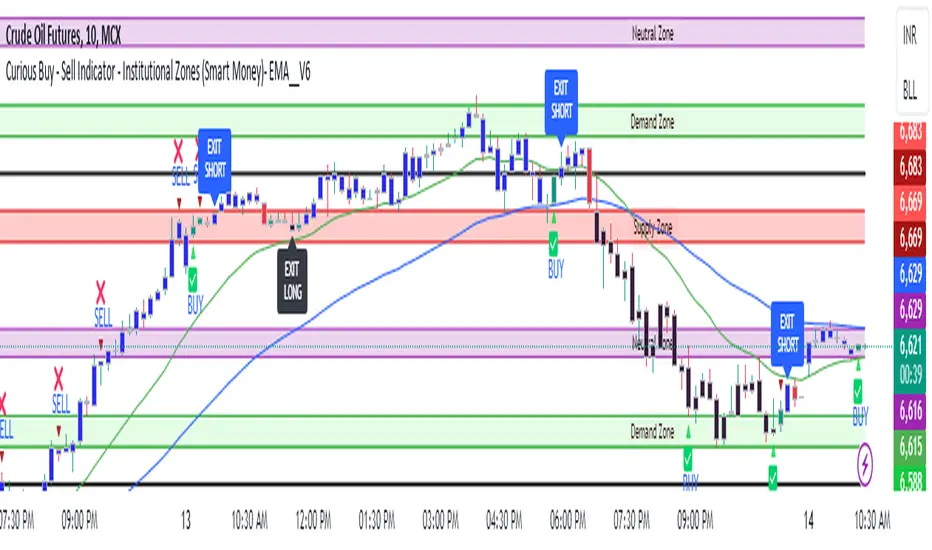
Curious Buy - Sell Indicator - Institutional Zones (Smart Money)How the Script Works:
1. The Scripts identifies Institutional Demand , Supply & Neutral Zones with FIBS on the scripts with Rectangle BOX with labels in advance. User can insert desired start and end value to plot institutional zones
2. Script generates BUY - SELL signals shape based on candle stick formation in live market and labels with BUY - SELL image for easy identification
3. Script gives pop message EXIT SHORT once Buy spotted and candle close above the buy signal and same way EXIT LONG once Sell spotted and candle close below the buy signal
4. Scripts identifies the candle closing above the BUY - SELL signals Eg - If buy spotted the candle closing above the BUY signal with display with BLUE color Candle same way for sell signal the candle closing below the sell signal candle with display with BLACK color candle.
5. Script spots fake signals which are not valid and can be ignored by the end user
6. Three EMA's 20,50,200 has implemented to identify the strength of the market
7. Scripts identifies OPEN = LOW & OPEN = HIGH candle stick to spot the Institutional BUY - SELL activity
8. The script provides visual clues on the chart to help users identify potential trading opportunities.
9. The script provides visual clues on the chart to help users identity potential trading opportunities in live market
10. The looks and parameters of the script can be modified by end user to customize and adapt to different strategy.
11. With the script user can check higher time frame DAILY \ WEEKLY BUY - SELL signals to plan intraday trades and plan safe BUY - SELL positions.
How Users Can Make Profit Using This Script:
1. Identify potential BUY - LONG opportunities: When a valid BUY is detected and condition is met, it is suggested to opening BUY position with stoploss below the BUY signal spotted candle.
Safe users can execute BUY position once BLUE COLOR candle is formed, Wait for pull back to reduce the stoploss
2. Identify potential SELL - SHORT opportunities: When a valid SELL is detected and condition is met, it suggests a potential opening SELL positions with stoploss above the BUY signal spotted candle. Safe users can execute SELL position once BLACK COLOR candle is formed, Wait for pull back to reduce the stoploss.
3. Script generated BUY - SELL signal met target with the Institutional zone. Eg if BUY spotted at demand zone target will be neutral zone & Supply zone.
4. Script designed for user to spot high probability trades when BUY SIGNAL SPOTTED at the Institutional Demand zone same way SELL SIGNAL SPOTTED AT INSTITUTIONAL supply zone.
5. Combine with additional analysis: Users can utilize this script as a tool in their overall trading strategy. They can combine the signals with fundament analysis , market sentiment to make more informed trading decision
6.Set risk management measures: It is important for users to implement proper risk management strategies when trading based on the scripts signals. To avoid potential losses user once spotted BUY - SELL execute the long or short position. Ensure to place the stoploss to avoid potential losses and place the target. Once your trade is moving in your favor
can trial your stoploss to cost and protect the profits.
Uptrick: MACD Slope Buy/Sell SignalsThe "Uptrick: MACD Slope Buy/Sell Signals" indicator is an advanced technical analysis tool meticulously crafted to provide traders with precise buy and sell signals derived from the slope changes of the Moving Average Convergence Divergence (MACD) signal line. This indicator integrates user-defined parameters for the MACD calculation, including the fast length, slow length, and signal smoothing period. These parameters allow traders to customize the indicator according to their specific trading strategies and timeframes, ensuring adaptability across various market conditions.
The primary function of this indicator is to monitor the slope of the MACD signal line and detect significant shifts that indicate potential changes in market momentum. The indicator calculates the slope by comparing the current value of the signal line to its previous value, and further determines the change in slope to identify acceleration or deceleration in the trend. A buy signal is generated when the slope of the signal line transitions from negative to positive, signaling an upward momentum, while a sell signal is triggered when the slope moves from positive to negative, indicating a downward trend. To enhance signal accuracy, the indicator distinguishes between regular and strong signals. A strong buy signal requires the slope change to be greater than the simple moving average (SMA) of recent slope changes, whereas a strong sell signal necessitates the slope change to be less than the negative SMA of recent slope changes.
A unique feature of this indicator is its dynamic and intuitive visualization. When a strong buy or sell signal is identified, it plots labels ('B' for buy and 'S' for sell) directly on the price chart. These labels are strategically positioned below or above the respective bars to ensure clear visibility and reduce chart clutter. The indicator also includes an option to connect consecutive signals with lines, which enhances the visual tracking of signal sequences and provides a coherent view of the trend's progression. The color intensity of the plotted signals varies based on the absolute value of the slope, offering an immediate visual cue on the strength of the detected trend changes. A steeper slope results in a darker color, signaling a stronger trend.
To facilitate comprehensive analysis, the indicator also plots the MACD and signal lines on the chart, providing traders with a reference to the underlying data that drives the buy and sell signals. These lines are color-coded for easy differentiation: the MACD line is typically blue, and the signal line is orange. This visual aid ensures that traders have a clear understanding of the indicator's basis and can cross-reference the generated signals with the MACD behavior.
The calculation of this indicator is grounded in well-established technical analysis principles. It employs the MACD function to derive the MACD line and signal line based on the user-defined parameters. The slope of the signal line is then computed, followed by the calculation of the slope change. The buy and sell signals are determined by comparing the current and previous slopes, and the strong signals are filtered through an additional layer of slope change analysis relative to its moving average.
The accuracy and reliability of the "Uptrick: MACD Slope Buy/Sell Signals" indicator stem from its thorough and methodical approach to signal generation. By combining user customization, detailed slope analysis, and robust visual elements, this indicator serves as a powerful tool for traders seeking precise entry and exit points in the market. Its ability to adapt to different trading styles and market conditions, coupled with its clear visual cues, makes it a valuable addition to any trader's toolkit, enhancing decision-making and improving trading outcomes.

Johnny's Adjusted BB Buy/Sell Signal"Johnny's Adjusted BB Buy/Sell Signal" leverages Bollinger Bands and moving averages to provide dynamic buy and sell signals based on market conditions. This indicator is particularly useful for traders looking to identify strategic entry and exit points based on volatility and trend analysis.
How It Works
Bollinger Bands Setup: The indicator calculates Bollinger Bands using a specified length and multiplier. These bands serve to identify potential overbought (upper band) or oversold (lower band) conditions.
Moving Averages: Two moving averages are calculated — a trend moving average (trendMA) and a long-term moving average (longTermMA) — to gauge the market's direction over different time frames.
Market Phase Determination: The script classifies the market into bullish or bearish phases based on the relationship of the closing price to the long-term moving average.
Strong Buy and Sell Signals: Enhanced signals are generated based on how significantly the price deviates from the Bollinger Bands, coupled with the average candle size over a specified lookback period. The signals are adjusted based on whether the market is bullish or bearish:
In bullish markets, a strong buy signal is triggered if the price significantly drops below the lower Bollinger Band. Conversely, a strong sell signal is activated when the price rises well above the upper band.
In bearish markets, these signals are modified to be more conservative, adjusting the thresholds for triggering strong buy and sell signals.
Features:
Flexibility: Users can adjust the length of the Bollinger Bands and moving averages, as well as the multipliers and factors that determine the strength of buy and sell signals, making it highly customizable to different trading styles and market conditions.
Visual Aids: The script vividly plots the Bollinger Bands and moving averages, and signals are visually represented on the chart, allowing traders to quickly assess trading opportunities:
Regular buy and sell signals are indicated by simple shapes below or above price bars.
Strong buy and sell signals are highlighted with distinctive colors and placed prominently to catch the trader's attention.
Background Coloring: The background color changes based on the market phase, providing an immediate visual cue of the market's overall sentiment.
Usage:
This indicator is ideal for traders who rely on technical analysis to guide their trading decisions. By integrating both Bollinger Bands and moving averages, it provides a multi-faceted view of market trends and volatility, making it suitable for identifying potential reversals and continuation patterns. Traders can use this tool to enhance their understanding of market dynamics and refine their trading strategies accordingly.

Uptrick: RSI MA Buying/Selling signalsIndicator Purpose:
This indicator, titled "Uptrick: RSI MA Buying/Selling signals" or "UpRSIMA," aims to provide buying and selling signals based on the Moving Average (MA) of the Relative Strength Index (RSI).
It plots the RSI MA line and highlights whether the RSI MA value is above or below 50, indicating potential bullish or bearish signals, respectively.
RSI Calculation:
The script calculates the RSI using a user-defined length parameter (default is 14) and a specified source (typically the closing price).
It then computes the MA of the RSI using the Recursive Moving Average (RMA) function applied to the RSI values.
Color Representation:
The color of the RSI MA line is determined based on whether it's above or below the neutral level of 50.
If the RSI MA is above 50, indicating potential bullish signals, the color is set to green; otherwise, it's set to red for potential bearish signals.
Plotting:
The RSI MA line is plotted on the chart with the specified color based on its value relative to 50.
Additionally, a horizontal line is drawn at y = 50 to visually represent the neutral level.
Histogram bars are also added to visually represent the difference between the RSI MA and the neutral level, with green bars indicating bullish signals and red bars indicating bearish signals.
User Interface:
The indicator is designed to be used as an overlay on price charts, allowing traders to easily visualize potential buying and selling signals based on RSI MA crossovers and levels relative to 50.
Overall, the "Uptrick: RSI MA Buying/Selling signals" indicator offers traders insights into potential trend reversals or continuations based on the moving average of the Relative Strength Index, aiding them in making informed trading decisions.

Multi-Divergence Buy/Sell IndicatorThe "Multi-Divergence Buy/Sell Indicator" is a technical analysis tool that combines multiple divergence signals from different indicators to identify potential buy and sell opportunities in the market. Here's a breakdown of how the indicator works and how to use it:
Input Parameters:
RSI Length: Specifies the length of the RSI (Relative Strength Index) calculation.
MACD Short Length: Specifies the short-term length for the MACD (Moving Average Convergence Divergence) calculation.
MACD Long Length: Specifies the long-term length for the MACD calculation.
MACD Signal Smoothing: Specifies the smoothing length for the MACD signal line calculation.
Stochastic Length: Specifies the length of the Stochastic oscillator calculation.
Stochastic Overbought Level: Defines the overbought level for the Stochastic oscillator.
Stochastic Oversold Level: Defines the oversold level for the Stochastic oscillator.
Calculation of Indicators:
RSI: Calculates the RSI based on the specified RSI Length.
MACD: Calculates the MACD line, signal line, and histogram based on the specified MACD parameters.
Stochastic: Calculates the Stochastic oscillator based on the specified Stochastic parameters.
Divergence Detection:
RSI Divergence: Identifies a bullish divergence when the RSI crosses above its 14-period simple moving average (SMA).
MACD Divergence: Identifies a bullish divergence when the MACD line crosses above the signal line.
Stochastic Divergence: Identifies a bullish divergence when the Stochastic crosses above its 14-period SMA.
Buy and Sell Conditions:
Buy Condition: Triggers a buy signal when all three divergences (RSI, MACD, and Stochastic) occur simultaneously.
Sell Condition: Triggers a sell signal when both RSI and MACD divergences occur, but Stochastic divergence does not occur.
Plotting Buy/Sell Signals:
The indicator plots green "Buy" labels below the price bars when the buy condition is met.
It plots red "Sell" labels above the price bars when the sell condition is met.
Usage:
The indicator can be used on any timeframe and for any trading instrument.
Look for areas where all three divergences (RSI, MACD, and Stochastic) align to generate stronger buy and sell signals.
Consider additional technical analysis and risk management strategies to validate the signals and manage your trades effectively.
Remember, no indicator guarantees profitable trades, so it's essential to use this indicator in conjunction with other tools and perform thorough analysis before making trading decisions.
Feel free to ask any questions

active buy/sell effectivenessIntrabar up/down movement divided by intrabar up/down volume , by counting the candles in a lower time frame. This shows how much active buy/sell orders can push the price and evaluate the selling/buying pressure, and can be used to identify potential swing highs and lows or to confirm patterns.

Wavy Tunnel + Trend ATR Buy Sell Signal by PaRnWavy Tunnel + Trend ATR Buy Sell Signal by PaRn
Originality by PaRn
First Combination of Wavy Tunnel + Trend ATR Buy Sell Signal by PaRn
"Buy Sell Signal" is base on Volatility Stop 20, Multiplier 2.5
"Trend Signal" is based on EMA crossover between EMA12(Close) and EMA26(Close)
Take Profit Line is EMA15(Default)
Wavy line Base on EMA34(high,close,low)
Tunnel line Base on EMA144(close),EMA169(close)
Green Candle Bar = "Uptrend"
Red Candle Bar = "Downtrend"
Buy when "Buy" Signal present
Follow Trend till the end of the trend : "Sell" Signal present
Buy More (Optional) = Green Arrow present on Uptrend
How to use Wavy Tunnel + Trend ATR Buy Sell Signal by PaRn
- Wavy Tunnel + Trend Signal can be used in any timeline from 5 Minutes to Weeks
- Price above both Wavy & Tunnel = "Uptrend"
- Green Candle Bar = Uptrend
- Buy when "Buy" Signal present
- Buy More (Optional) = Green Arrow present on Uptrend
- Hold your possition and Follow Trend till the end of the trend : "Sell" Signal present, It's time to sell all position
NOT RECOMMEND TO USE ON SIDEWAY MARKET

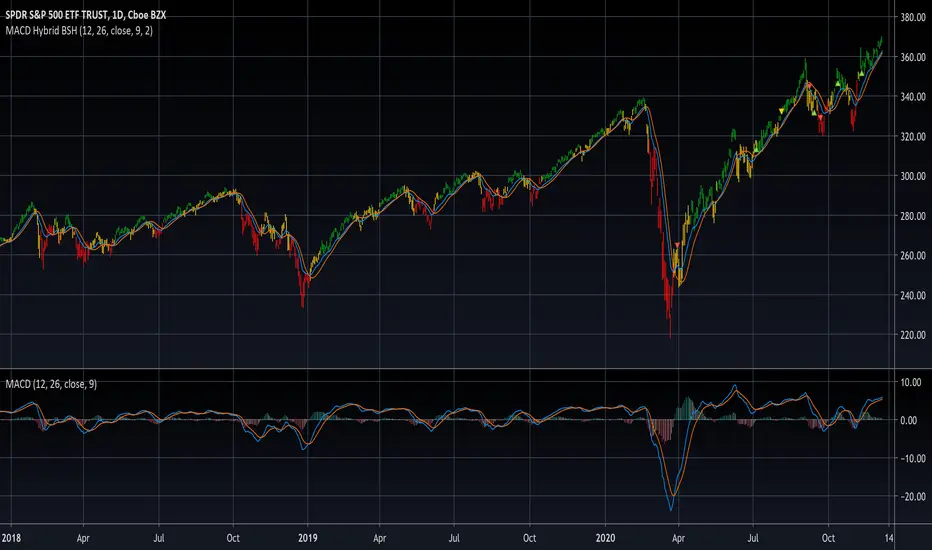
MACD Hybrid BSHMACD = Moving Average Convergence and Divergence
Hybrid = Combining the two main MACD signals into one indicator
BSH = Buy Sell Hold
This indicator looks for a crossover of the MACD moving averages (12ema and 26ema) in order to generate a buy/sell signal and a crossover of the MACD line (12ema minus 26ema) and MACD signal line (9ema of MACD line) in order to generate a completely seperate buy/sell signal. The two buy/sell signals are combined into a hybrid buy/sell/hold indicator which looks for one, neither, or both signals to be "buys." If both signals are buys (fast crossed above slow), a "buy" signal is given (green bar color). If only one signal is a buy, a "hold" signal is given (yellow bar color). If neither signal is a buy, a "sell" signal is given (red bar color). Note: MACD moving averages crossing over is the same thing as the MACD line crossing the zero level in the MACD indicator.
It makes sense to have the MACD indicator loaded as a reference when using this but it isn't required. The lines plotted on the chart are the 12ema and a signal line which is the MACD signal line shown relative to the 12ema rather than the MACD line. The 26ema is not plotted on the chart because the chart becomes cluttered, plus the moving averages crossing over is indicated with the MACD indicator.
This indicator should be used with other indicators such as ATR (1), RSI (14), Bollinger bands (20, 2), etc. in order to determine the best course of action when a signal is given. One way to use this as a strict system is to take a neutral cash position when a yellow "hold" signal is given, to go long when a
green "buy" signal is given, and to go short when a red "sell" signal is given. It can be observed that for many tickers and timeframes that green-yellow-green and red-yellow-red sequences are stronger signals than green-yellow-red and red-yellow-green signals.
Note: Chart type must be "bars" in order for the bar colorization to work properly
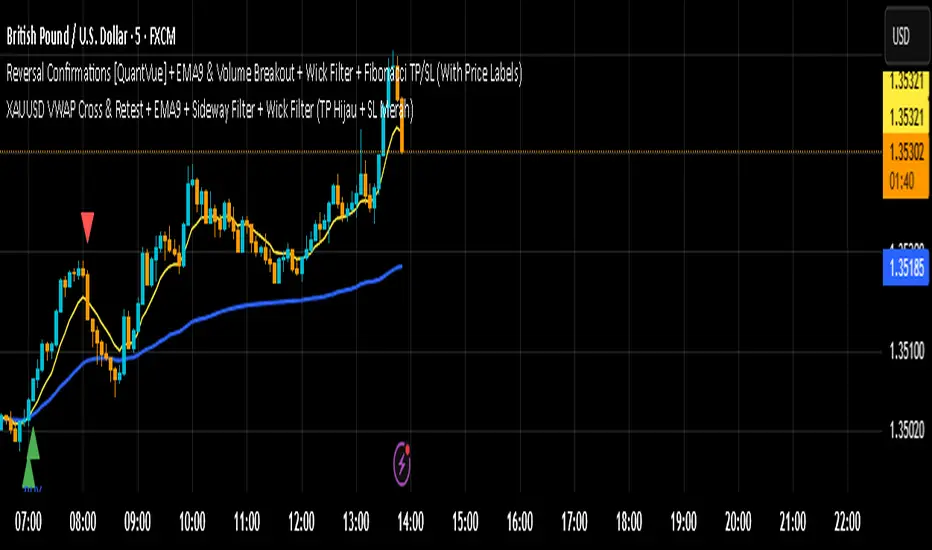
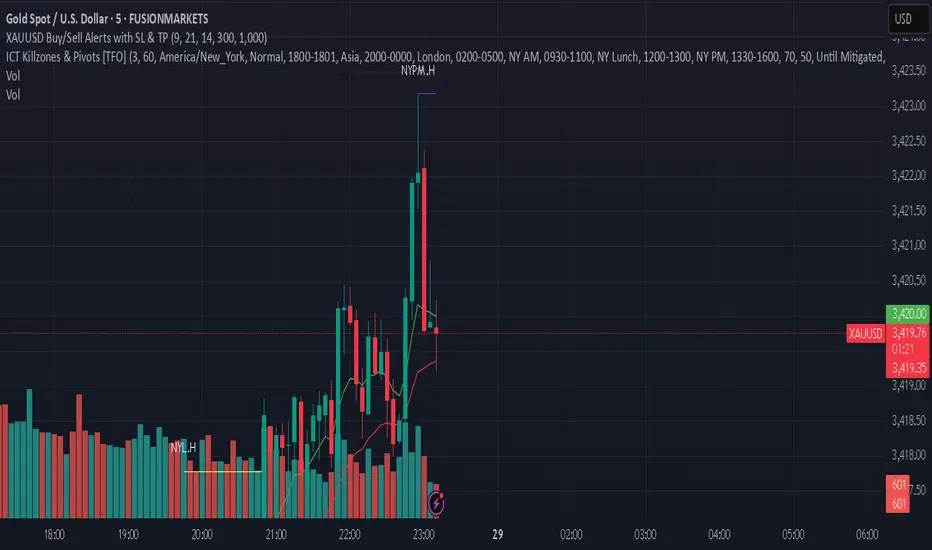
XAUUSD Buy/Sell Alerts with SL & TPThis custom TradingView indicator identifies high-probability buy and sell signals on XAUUSD using EMA crossovers combined with RSI confirmation. Designed for precision entries, it automatically calculates optimal Stop Loss (SL) and Take Profit (TP) levels based on user-defined pip distances.
Key Features:
Fast and Slow EMA crossover for trend direction
RSI filter for momentum confirmation
Dynamic SL and TP levels to manage risk and reward
Visual buy/sell signals plotted on chart
Real-time alerts with detailed messages including entry price, SL, and TP
Suitable for multiple timeframes and trading styles
Perfect for traders seeking clear signals with built-in risk management for scalping or swing trading XAUUSD.
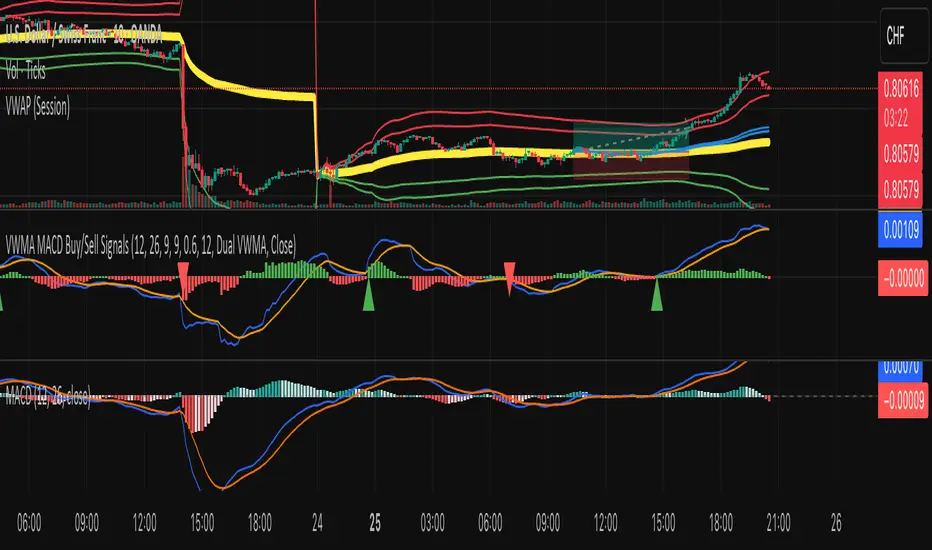
VWMA MACD Amanita Buy/Sell Signals VWMA MACD Amanita Buy/Sell Signals – Volume-Weighted Momentum Indicator
A twist on the classic MACD: this indicator uses Volume Weighted Moving Averages (VWMA) instead of EMAs, giving more weight to price moves backed by higher volume.
Features:
VWMA-based MACD line & signal line
Histogram highlights bullish/bearish momentum
Color-coded for easy visualization
Quick Guide:
MACD above Signal → bullish
MACD below Signal → bearish
Rising histogram → strengthening trend
Falling histogram → weakening trend
Perfect for traders who want momentum confirmed by volume.
OHLC Horizontal Compact + Volume + Buy/SellA compact, single-row horizontal table for TradingView displaying Open, High, Low, Close (OHLC), net change, percentage change, volume, and buy/sell pressure percentages. The table is fully color-coded for easy interpretation: green for positive values, red for negative, and yellow for neutral. Table position is fully customizable (top, middle, bottom / left, center, right). Ideal for traders who want a concise, real-time snapshot of price action and market sentiment in a single row.
Features:
OHLC values in one horizontal row
Net change (Δ) and % change with directional arrows
Real-time volume display
Buy/Sell pressure % with dynamic coloring
Fully customizable table placement
Works on all timeframes

KhoiHV - Bollinger Bands Buy/Sell Area ProBollinger Bands Buy/Sell Area Pro is a professional-grade indicator designed to identify potential trading opportunities based on Bollinger Bands. It highlights dynamic buy and sell areas by combining price action with volatility, helping traders quickly visualize market conditions.
✨ Key Features
Automatically plots upper, middle, and lower Bollinger Bands.
Marks Buy Areas when price enters oversold zones near the lower band.
Marks Sell Areas when price enters overbought zones near the upper band.
Configurable inputs for length, source, and multiplier to fit any trading style.
Easy-to-read chart visuals with colored zones for instant recognition.
💡 How to Use
Look for Buy Areas near the lower band in trending markets to catch potential rebounds.
Watch for Sell Areas near the upper band to anticipate possible pullbacks.
Combine with volume, momentum, or trend indicators for stronger confirmation.
This tool is especially useful for traders who want a clear, visual edge in spotting volatility-based entries and exits without constantly recalculating signals.
Zero-Lag Scalper with Trend Line (BUY/SELL labels) BY RAHZero-Lag Scalper with Trend Line (BUY/SELL labels) BY RAH

Razor Precision — Buy/SellRazor Precision Stock Action Indicator
The Razor Precision indicator is an advanced, multi-layered market analysis tool designed for traders who demand accuracy and alignment across multiple timeframes. It combines price action, moving average crossovers, volume confirmation, swing structure mapping, and indicator confluence (RSI, MACD, ATR, OBV) to generate actionable buy/sell strength ratings.
Key Features:
Price Action Detection: Identifies higher highs/lows (uptrend) and lower highs/lows (downtrend).
MA Crossover Momentum: Monitors 50/200 moving average crossovers to detect trend shifts.
Volume Surge Analysis: Confirms breakouts or pullbacks with significant volume spikes.
Swing Structure Tracking: Maps internal/external breaks to align with Smart Money Concepts.
Indicator Confluence: Aggregates signals from RSI, MACD, ATR, and OBV for precision confirmation.
Multi-Timeframe Alignment: Compares trends across 15m, 1H, 4H, and Daily charts for stacked or conflicting signals.
Strength Levels: Signals range from SELL, STRONG SELL, ULTRA STRONG SELL to BUY, STRONG BUY, ULTRA STRONG BUY.
Dynamic Table Display: Updates every 5 minutes or when overall action changes, showing per-timeframe analysis and the aggregated decision.
Ideal for swing traders, scalpers, and intraday momentum players who want high-confidence trade direction filtered through multiple technical layers.

RSI + MACD + EMA Buy/Sell ComboRSI + MACD + EMA Buy/Sell Combo with signals if all 2 lines up it will create buy and cell signals